What goes around comes around. Back in the day everything was done on the command line. Storage administrators had their scripts, their hands never had to leave the keyboard, they could provision storage quickly and efficiently, and life was good. Then the age of the easy to use GUI came into effect. Non-storage administrators could deploy their own capacity, and vendors espouse how much easier and more effective IT generalists could be in managing multiple petabytes of capacity with the mouse. Now we’re into the age of the API. Storage along with all other IT resource domains has its reporting API and developers are now writing code to automatically report on and provision storage in the enterprise. And many shops have realized that the command line is as effective an API for automating reports and doing rapid deployments as any REST based API could be.
So I’m getting a lot of questions again how to do some basic reporting on a VMAX storage array from command line generated or API generated data. Customers are writing their own reporting dashboards to support multiple frameworks.
The most fundamental question is how much of my storage array have I consumed? Assuming one is inquiring about capacity and not performance, there are two aspects to that question. The first question is from the business, “How much capacity has been allocated to my hosts?” In other words how much capacity do my hosts perceive they have been assigned? In an EMC VMAX array this has to do with the Subscription rate. For better or for worse we provide a Subscription percentage of a pool that has been Subscribed, as opposed to an absolute value of capacity.
To calculate how much of your array has been Subscribed, sum the products of the Pool % Subscribed by Pool Total Available GB to get the total capacity Subscribed to the hosts.
EFD Pool Subs % * EFD Pool Total GBs = EFD Subscribed GB
FC Pool Subs % * FC Pool Total GB = FC Subscribed GB
SATA Pool Subs % * SATA Pool Total GB = SATA Subscribed GB
Sum the totals above = Array Subscribed GB
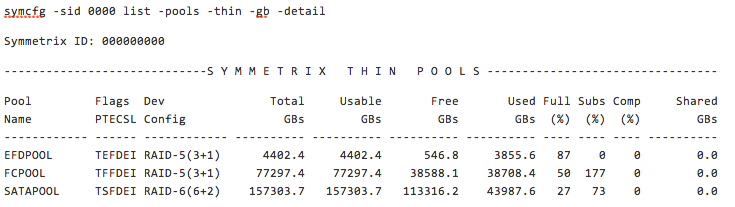
Using the example above, this would be:
0% * 4,402.4 = 0.0  EFD Subscribed GB
177% * 77,297.4 = 136,816.398 FC Subscribed GB
73% * 157,303.7 = 114,831.701 SATA Subscribed GB
251,648.099 Array Subscribed GB
Then compare that number to the sum of the Total GBs provided by each of your three pools to reveal the ratio of the subscribed array capacity versus the total available capacity.
If you’re Array Subscribed GB is larger than your Array Total GB, then tread carefully since you have oversubscribed your array’s capacity!
Subscribed GB / Array Total GB = Array Subscription Rate
251,648.099 / 239,003.5 = 105.29% oversubscribed in this case!
To understand how much capacity has been filled physically allocated on the array after all data reduction technologies have done their job (thin provisioning, compression, de-dupe), simply sum the Used GBs capacity from each of your pools to show an overall array consumed capacity. Compare this number to the previously mentioned subscription capacity to show the benefit of data reduction technologies in the array.
Sum of Used GBs above is ( 3855.6 + 38708.4 + 43987.6 ) = 86,551.6 GB
251,648.099 Subscribed GB / 86,551.6 Consumed GB = 2.9 : 1 Data Reduction provided by Thin Provisioning! Not bad at all!
Likewise sum the free capacity measures from each pool together to get the available capacity remaining in the array.
There you have it. If you’re not into the GUI, just a little math provide you the dashboard data you need to show your executives the capacity utilization of the array.
Happy hacking!

Hey Scott
Great post, has come in very useful for something I’m working on, thanks for writing this up.
Cheers
Craig
Very well written article Scott. Cheers :)
Great article
Hi Scott, How would you come up with a number For VMAX3 Storage? It uses SLO so the tier or the Disk group usage fluctuates all the time. How can we get the exact or apporax numbers? Thanks.
Very helpful article
Hello Scott. Thanks for an excellent explanation. Will it be the same for VMAX 400K?
Hello All
ive noticed that the % subscribed column is now gone with Solutions Enabler v9.0. Here is a link from EMC: https://emcservice.force.com/CustomersPartners/kA2f1000000GAeBCAW
symcli used prior with SE v8.4 is: “symcfg -sid XXX list -srp -detail -tb” – which would previously pull the % subscribed column. Anyone know any other way to retrieve subscribed in percentage ?